Part 5: Potential step technique (CA, CC, STEP)
In these techniques, the potential is changed from one value to a second value and the current (chronoamperometry) or charge (chronocoulometry) response is monitored as a function of time (note that the charge is an integral of the current). After holding the potential at a second potential for some time τ, the potential is changed to a third value (which is often the original potential value). Therefore, a potential step experiment is a single step or a double step.
The general variables differ slightly between chronoamperometry and chronocoulometry.
In the case of chronoamperometry, an initial potential (initial E), a high potential and a low potential are required. The potential is changed from an initial potential to a low potential or a high potential (this depends on the initial P/N variable). After a time τ (pulse width) the potential is changed in the opposite direction (low potential to high potential or high potential to low potential) and held at this value of potential for time τ (see Fig. 5-1). In the case of chronocoulometry the potential is an initial potential (initial E) and a final potential (final E) (see Fig. 5-2).
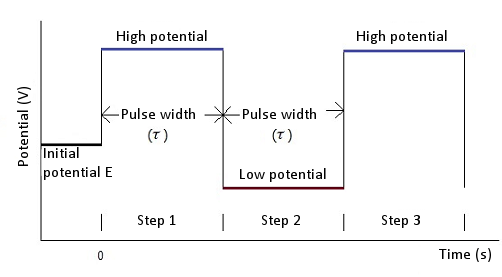
Fig. 5-1 Potential waveform of chronoamperometry
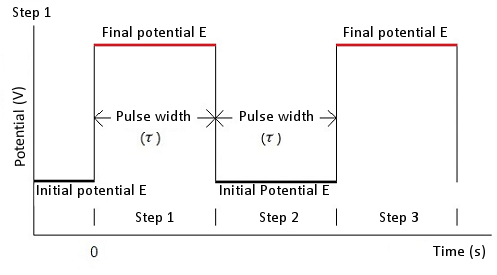
Fig. 5-2 Potential waveform of chronocoulometry
The current/charge response depends on the initial and final potential values. If the Faraday reaction does not occur at either potential (the Faraday reaction is the electrolysis of a molecular species in solution), the response will be a current due to the charging of the electrode (charging or capacitive current or background current).
The response decreases exponentially with current spikes. Often, the initial potential is set at a potential at which no Faraday reaction occurs, and the final potential is set at a potential at which the Faraday reaction occurs rapidly. In other words, the diffusion rate. The diffusion-dominated current. As soon as they reach the surface of the working electrode. The magnitude of the current is determined by the rate of mass transfer from the bulk solution to the surface of the working electrode. That is, the diffusion rate. The current caused by diffusion control is given by the following Cottrell equation.
where: n = number of electron transfers per molecule; F = Faraday constant (96,500 C/mol); i = current (A); C = concentration (mol/cm3); t = time (s); A = electrode area (cm2) ); D = diffusion coefficient (cm2/s)
The Faraday current resulting from diffusion domination decays at t-1/2 (typical chronoamperogram, see Fig. 3).
A similar expression for the charge due to diffusion dominance (Qdiff) is the integral of the above equation (That is Q is proportional to t1/2) and a typical chronocoulogram is shown in Fig. 5-4.
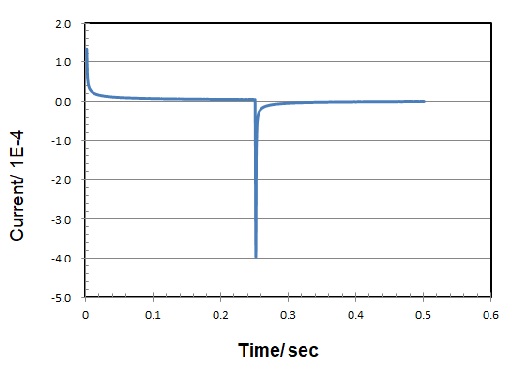
Fig. 5-3 Chronoamperogram (current vs. time response)
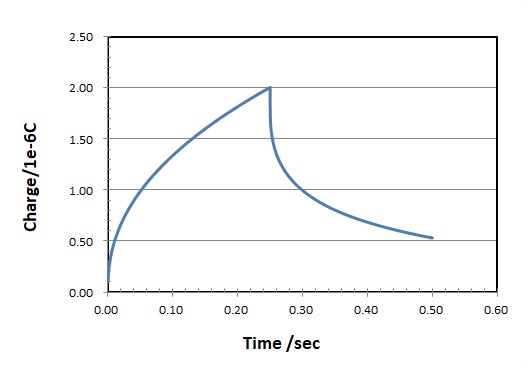
Fig. 5-4 Chronocoulogram (charge vs. time response)
The CA and CC are used to determine one of n, C, A, D using the slope of a linear plot. However, three of the four parameters must be known. However, other techniques (for example, the pulse technique described below) have lower detection limits, so CA and CC are not commonly used for concentration measurements. A and D are often measured using these techniques.
The relationship between i and t-1/2 or Q and t1/2 is used to determine the time interval in which the current (or charge) is tightly controlled by diffusion. Fig. 5-5 is a plot of i/t-1/2 over time. The deviation from the theoretical value in a short time depends on the length of time required to charge the working electrode with the step potential. The deviation from the theoretical value over a long period of time is due to natural convection.
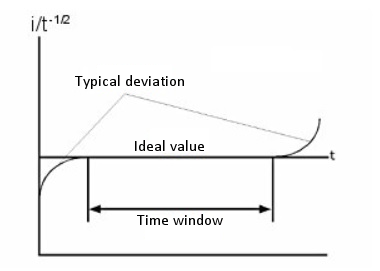
The CA and CC are not used to measure absolute concentrations, but are used to measure changes in concentration due to homogeneous chemical reactions of electrolyzed molecules. This is done by measuring the ratio of forward to backward current (charge) using a double step technique. If the products undergo a chemical reaction after electrolysis in the forward step, these product molecules are less likely to be supplied for electrolysis in the reverse step. Therefore, the faster the chemical reaction, the smaller the current/charge in the reverse step. The chemical reaction rate is calculated by measuring the current (or charge) ratio with different pulse widths.
If the final potential is a value at which electron transfer does not occur rapidly, the current (or charge) response will be affected by the non-uniform electron transfer rate as well as the diffusion rate. Therefore, the electron transfer rate is measured by CA and CC.
The CC has several advantages over the CA. The signal increases with time. The latter part of the response is not distorted by the charging current which is concentrated at the beginning, so a good signal-to-noise ratio is achieved. In addition, since the charge is added during the experiment, the information from the initial response is retained.
Another application of CC that takes advantage of the fact that it can retain initial information is the detection of species adsorbed on the surface of the working electrode. Such species are electrolyzed very quickly as soon as the potential is changed. The total charge measured during chronocoulometry is
Qdl is the amount of charge due to the charging of the working electrode and Qads is the amount of charge due to the electrolysis of the adsorbed species and is proportional to the surface concentration of the adsorbed material. Of the three components, only Qdiff is time-dependent. One way of calculating Qads is to measure the difference in Qdl by performing a CC experiment on a background solution.
However, this assumes that the Qdl is the same with or without electrochemically active species. This is not necessarily true. A more accurate method is to use a double step CC.
This is because Qdl can be removed by calculating the difference between the intercepts of the forward and reverse Anson plots (Fig. 5-6).
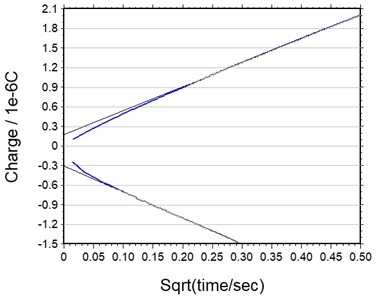
Fig. 5-6 Forward/reverse Anson diagram.

