Part 2: Cyclic voltammetry - II
M.Sc. Takayuki Tezuka
3. Current - Potential curve
A typical cyclic voltammetry example is the current - potential curve of a solution containing ferricyanide ion (2 mmol/L potassium ferricyanide + 1 mol/L potassium nitrate). In this one-electron redox reaction, the ferricyanide ion Fe(CN)63− is an oxidant and the ferrocyanide ion Fe(CN)64− is a reductant.

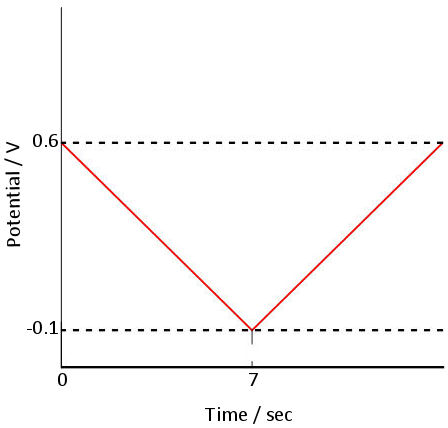
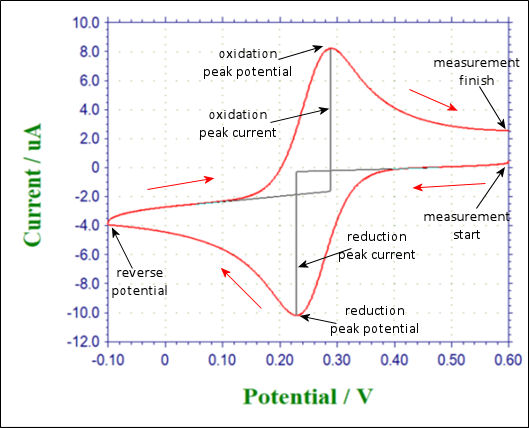
Fig. 3.1 Shows the applied potential variation as a function of the time, and it sweeps at a scan rate of 100 mV/s in the negative direction (reduction direction), from 0.6 V to -0.1 V vs Ag/AgCl reference electrode. The result is shown in the cyclic voltammogram (Fig. 3-2). The current, which was about 0 A at the start of the measurement, starts to flow in the first segment of sweeping the potential in the negative direction, and the current for the reduction (the sign is minus in this figure) flows out, reaching the reduction peak at 0.229 V. The current observed at this time is called the reduction peak current. After that, the potential sweep direction is turned back at -0.1 V, and oxidation of ferrocyanide ion starts at around 0.1 V, and an oxidation peak is observed at 0.289 V. The difference between the oxidation peak potential and the reduction peak potential is called the peak potential difference, and the value is close to 0.059/n V (59/n mV) at 25°C. Note that n is the number electrons transferred. However, this equation can only be applied in case of fast electrons transfer.

where: ΔE is redox peak potential difference, Epa is peak anodic potential,
Epc is peak cathodic potential and n is number of electrons transferred.
The midpoint potential between the two peak potential (midpoint potential) Em (0.259 V) is approximate to the standard electrode potential Eo, because there is no difference between diffusion rate (diffusion coefficient) for oxidant and reductant. Thus cyclic voltammetry is often used to estimate the approximately standard electrode potential Eo.

where: Em is midpoint potential, Epa is peak anodic potential,
Epc is peak cathodic potential and E0 is standard reduction potential.


Fig. 2-3-1 Time change of sweep potential Fig. 2-3-2 Cyclic voltammetry

