Basis of Electrochemical Technique
- Part 1: Cyclic voltammetry - I
- Part 2: Cyclic voltammetry - II
- Part 3: Cyclic voltammetry - III
- Part 4: Cyclic voltammetry - IV
- Part 5: Potential step technique
- Part 6: Pulse Technique/Step Wave Voltammetry (SCV)
- Part 7: Normal Pulse Voltammetry (NPV)
- Part 8: Differential Pulse Voltammetry (DPV)
- Part 9: Osteryoung square wave voltammetry (OSWV)
- Part 10: Alternating Current (AC) Technology (ACV, SHACV)
- Part 11: Hydrodynamic Modulation (HDM)
- Part 12: Amperometry technique (i-t)
- Part 13: Double Differential Pulse Amperometry (DDPA)
- Part 14: Triple Pulse Amperometry (TPA)
- Part 15: Integrated Pulsed Amperometric Detection (IPAD)
- Part 16: Bulk Electrolysis (BE)
- Part 17: Impedance (IMP)
- Part 18: Impedance-Time (IMPT)
- Part 19: Impedance-Potential (IMPE)
- Part 20: Chronopotentiometry (CP)
- Part 21: Chronopotentiometry with Current Ramp (CPCR)
- Part 22: Sweep-Step Functions (SSF)
- Part 23: Multi potential step method (STEP) and Multi current step method (ISTEP)
- Part 24: Potentiometric stripping analysis (PSA)
Part 1: Cyclic voltammetry - I
M.Sc. Takayuki Tezuka
1. Potential sweep technique (Potentiodynamic method)
The potential sweep technique refers to a measurement of the current change in function of the time (this is called “potential sweep” or “potential scan”) by changing the potential (applied potential) to the working electrode over time. If the sweep direction is one direction only, it is called linear sweep voltammetry. Once the potential is swept, the sweep direction is reversed to continue the potential sweep, and repeat the reversal, it is called cyclic voltammetry. The result is usually displayed as a current-potential curve (voltammogram) by combining two time-varying parameters (current, potential). At this time, the voltammetric response current represents the response to the applied potential of the electrode reaction, as well as the time course of the electrode reaction as in chronoamperometry.
Fig. 1-1 Cyclic voltammetry
2. Three electrodes electrochemical cell and current direction
Basically, in this voltammetric technique, three types of electrodes are connected to the potentiostat as shown in Fig. 1.2. The current flowing between the working electrode and the counter electrode is detected while controlling the electrode potential of the working electrode with respect to the potential of the reference electrode. This is done by detecting the current flowing between the two electrodes. When an oxidation reaction occurs at the working electrode interface, electrons flow from the working electrode to the counter electrode from the external circuit connected to the potentiostat, so current flows from the counter electrode to the working electrode.
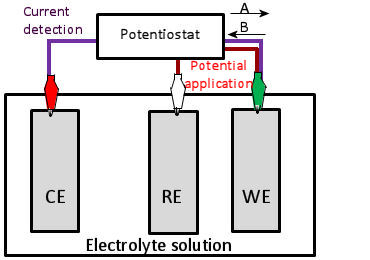
A Orientation direction of response current flow during oxidation.
B Orientation direction of electrons flow during oxidation.
Fig. 1-2 Potentiostat and electrode connection
Part 2: Cyclic voltammetry - II
M.Sc. Takayuki Tezuka
3. Current - Potential curve
A typical cyclic voltammetry example is the current - potential curve of a solution containing ferricyanide ion (2 mmol/L potassium ferricyanide + 1 mol/L potassium nitrate). In this one-electron redox reaction, the ferricyanide ion Fe(CN)63− is an oxidant and the ferrocyanide ion Fe(CN)64− is a reductant.

Fig. 3.1 Shows the applied potential variation as a function of the time, and it sweeps at a scan rate of 100 mV/s in the negative direction (reduction direction), from 0.6 V to -0.1 V vs Ag/AgCl reference electrode. The result is shown in the cyclic voltammogram (Fig. 3-2). The current, which was about 0 A at the start of the measurement, starts to flow in the first segment of sweeping the potential in the negative direction, and the current for the reduction (the sign is minus in this figure) flows out, reaching the reduction peak at 0.229 V. The current observed at this time is called the reduction peak current. After that, the potential sweep direction is turned back at -0.1 V, and oxidation of ferrocyanide ion starts at around 0.1 V, and an oxidation peak is observed at 0.289 V. The difference between the oxidation peak potential and the reduction peak potential is called the peak potential difference, and the value is close to 0.059/n V (59/n mV) at 25°C. Note that n is the number electrons transferred. However, this equation can only be applied in case of fast electrons transfer.

where: ΔE is redox peak potential difference, Epa is peak anodic potential,
Epc is peak cathodic potential and n is number of electrons transferred.
The midpoint potential between the two peak potential (midpoint potential) Em (0.259 V) is approximate to the standard electrode potential Eo, because there is no difference between diffusion rate (diffusion coefficient) for oxidant and reductant. Thus cyclic voltammetry is often used to estimate the approximately standard electrode potential Eo.

where: Em is midpoint potential, Epa is peak anodic potential,
Epc is peak cathodic potential and E0 is standard reduction potential.
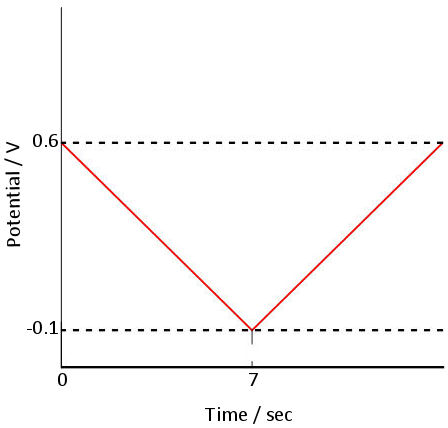
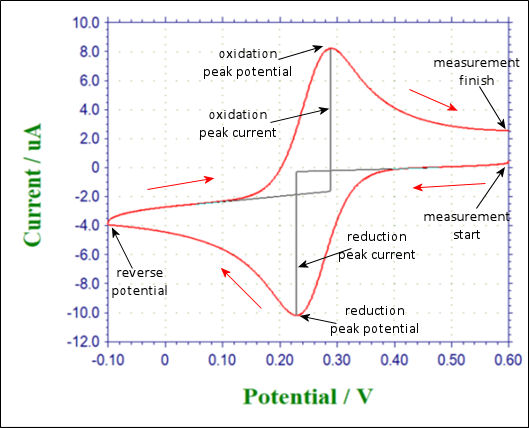
Fig. 2-3-1 Time change of sweep potential Fig. 2-3-2 Cyclic voltammetry
Part 3: Cyclic voltammetry - III
M.Sc. Takayuki Tezuka
4. Peak Current
The faradaic current at the peak value is referred to as the peak current, and it is known that the following equation can be adapted to the peak current of reversible reactions with fast electrons transfer. (Randles - Sevcik equation).

where: ip is peak current, F is Faraday constant (96485 C/mol),
A is working electrode surface area, D is diffusion coefficient,
c is concentration, v is scan rate, R gas constant (8.31 J.K-1.mol-1),
and T is temperature.
At 25°C, this equation summarizes the constants and is expressed as follows.

The peak current is proportional to the concentration c of the redox substance and the square root of the scan rate v.
Fig. 3-4-1 shows the result of cyclic voltammetry of 2 mmol/L potassium ferricyanide solution at scan rates of 0.01, 0.04, and 0.09 V/s. Fig. 3-4-2 plots the relationship between the square root of the scan rate and the reduction peak current, and it can be seen that there is a linear relationship. Also parameters such as the diffusion rate D can be get by drawing an approximate line for this plot and using its slope.
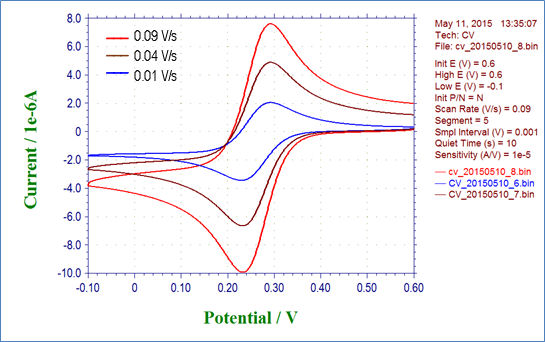
Fig. 3-4-1 Cyclic voltammogram of 2 mmol/L K3Fe(CN)6 varying the scan rate.
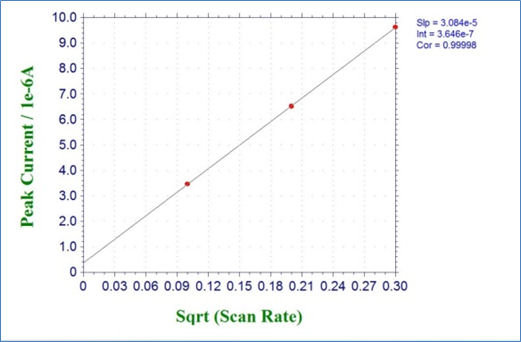
Fig. 3-4-2 Plots of reduction peak current versus square root of the scan rate.
Part 4: Cyclic voltammetry - IV
M.Sc. Takayuki Tezuka
5. Faraday current and charging current
In cyclic voltammetry, besides of the Faraday current caused by the redox reaction, the charging current, the current flows due to charge and discharge in the electric double layer formed at the electrode interface. This is generally corrected by subtracting the measured (background) cyclic voltammetry of the electrolyte containing no redox substance.
Fig. 4-5-1 shows the cyclic voltammogram (red line) and overwrited background (brown line), and the red line subtracted the background, the (blue line).
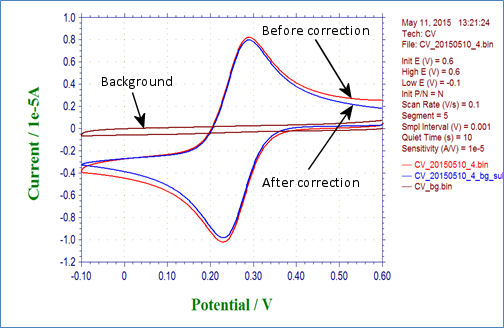
Fig. 4-5-1 Cyclic voltammogram before correction (red line), background (brown line) and after correction (blue line)
6. Quasi-reversible and non-reversible cyclic voltammetry
An electrochemical reaction with a slow electron transfer rate at the electrode interface is called as a non-reversible reaction. This is due to the reaction rate constant k0 (n is the number of electrons transferred).
Reversible: k0 > 0.3(nv)1/2
Quasi-reversible: 2 x 10⁻⁵ (nv)1/2 < k0 < 0.3(nv)1/2
Non-reversible: k0 < 2 x 10⁻⁵ (nv)1/2
Fig. 4-6-1 is a cyclic voltammogram of a quasi-reversible reaction, which the reaction rate k0 of cyclic voltammogram is changed using simulation software. In such cyclic voltammogram, although the peak potential difference spreads, the midpoint potential Em can be used to estimate the standard electrode potential E0 if the extent of spread is almost the same on the oxidation side and the reduction side. While, when a clear peak does not appear, it becomes difficult to estimate the standard electrode potential E0 from the midpoint potential Em.
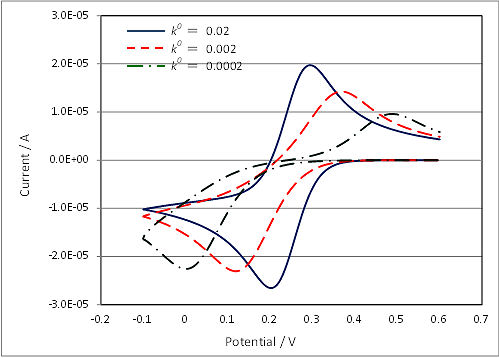
Fig. 4-6-1 Cyclic voltammograms of varying reaction rate.
As described above, the criteria for classification of reversible and non-reversible reactions using reaction rate constants depend on the number of electrons tranferred (n) and the square root of the scan rate (v), respectively. Thus, for example, in the case of one-electron reaction of k0 = 0.05 cm/s, it is quasi-reversible at v = 0.1 V/s, but reversible at v = 0.01 V/s. Thus, even if the sample to be measured is the same, in some cases it become possible to analyze as a reversible reaction by reducing the scan rate of cyclic voltammetry.
Part 5: Potential step technique (CA, CC, STEP)
In these techniques, the potential is changed from one value to a second value and the current (chronoamperometry) or charge (chronocoulometry) response is monitored as a function of time (note that the charge is an integral of the current). After holding the potential at a second potential for some time τ, the potential is changed to a third value (which is often the original potential value). Therefore, a potential step experiment is a single step or a double step.
The general variables differ slightly between chronoamperometry and chronocoulometry.
In the case of chronoamperometry, an initial potential (initial E), a high potential and a low potential are required. The potential is changed from an initial potential to a low potential or a high potential (this depends on the initial P/N variable). After a time τ (pulse width) the potential is changed in the opposite direction (low potential to high potential or high potential to low potential) and held at this value of potential for time τ (see Fig. 5-1). In the case of chronocoulometry the potential is an initial potential (initial E) and a final potential (final E) (see Fig. 5-2).
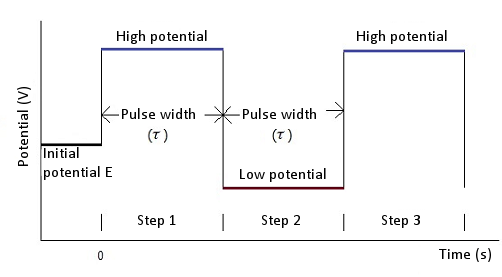
Fig. 5-1 Potential waveform of chronoamperometry
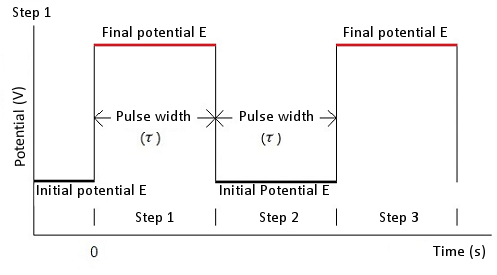
Fig. 5-2 Potential waveform of chronocoulometry
The current/charge response depends on the initial and final potential values. If the Faraday reaction does not occur at either potential (the Faraday reaction is the electrolysis of a molecular species in solution), the response will be a current due to the charging of the electrode (charging or capacitive current or background current).
The response decreases exponentially with current spikes. Often, the initial potential is set at a potential at which no Faraday reaction occurs, and the final potential is set at a potential at which the Faraday reaction occurs rapidly. In other words, the diffusion rate. The diffusion-dominated current. As soon as they reach the surface of the working electrode. The magnitude of the current is determined by the rate of mass transfer from the bulk solution to the surface of the working electrode. That is, the diffusion rate. The current caused by diffusion control is given by the following Cottrell equation.
where: n = number of electron transfers per molecule; F = Faraday constant (96,500 C/mol); i = current (A); C = concentration (mol/cm3); t = time (s); A = electrode area (cm2) ); D = diffusion coefficient (cm2/s)
The Faraday current resulting from diffusion domination decays at t-1/2 (typical chronoamperogram, see Fig. 3).
A similar expression for the charge due to diffusion dominance (Qdiff) is the integral of the above equation (That is Q is proportional to t1/2) and a typical chronocoulogram is shown in Fig. 5-4.
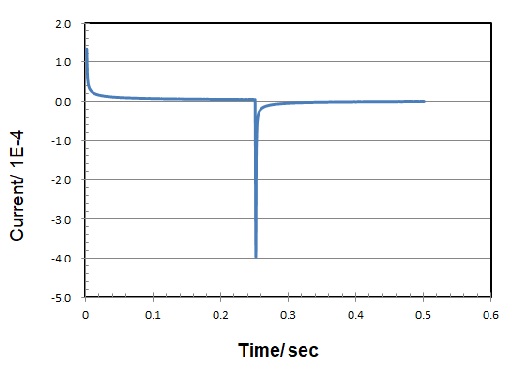
Fig. 5-3 Chronoamperogram (current vs. time response)
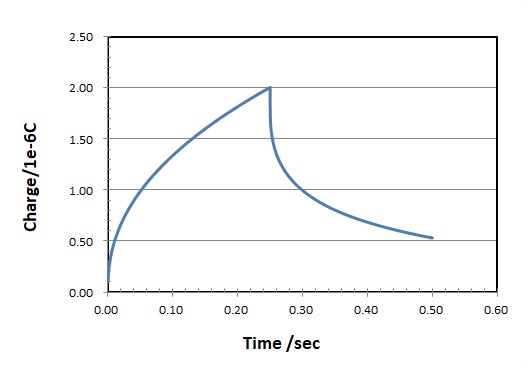
Fig. 5-4 Chronocoulogram (charge vs. time response)
The CA and CC are used to determine one of n, C, A, D using the slope of a linear plot. However, three of the four parameters must be known. However, other techniques (for example, the pulse technique described below) have lower detection limits, so CA and CC are not commonly used for concentration measurements. A and D are often measured using these techniques.
The relationship between i and t-1/2 or Q and t1/2 is used to determine the time interval in which the current (or charge) is tightly controlled by diffusion. Fig. 5-5 is a plot of i/t-1/2 over time. The deviation from the theoretical value in a short time depends on the length of time required to charge the working electrode with the step potential. The deviation from the theoretical value over a long period of time is due to natural convection.
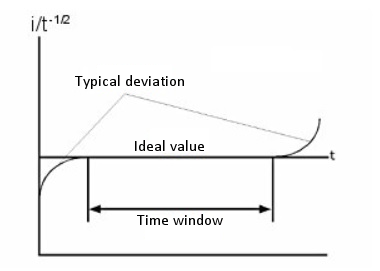
The CA and CC are not used to measure absolute concentrations, but are used to measure changes in concentration due to homogeneous chemical reactions of electrolyzed molecules. This is done by measuring the ratio of forward to backward current (charge) using a double step technique. If the products undergo a chemical reaction after electrolysis in the forward step, these product molecules are less likely to be supplied for electrolysis in the reverse step. Therefore, the faster the chemical reaction, the smaller the current/charge in the reverse step. The chemical reaction rate is calculated by measuring the current (or charge) ratio with different pulse widths.
If the final potential is a value at which electron transfer does not occur rapidly, the current (or charge) response will be affected by the non-uniform electron transfer rate as well as the diffusion rate. Therefore, the electron transfer rate is measured by CA and CC.
The CC has several advantages over the CA. The signal increases with time. The latter part of the response is not distorted by the charging current which is concentrated at the beginning, so a good signal-to-noise ratio is achieved. In addition, since the charge is added during the experiment, the information from the initial response is retained.
Another application of CC that takes advantage of the fact that it can retain initial information is the detection of species adsorbed on the surface of the working electrode. Such species are electrolyzed very quickly as soon as the potential is changed. The total charge measured during chronocoulometry is
Qdl is the amount of charge due to the charging of the working electrode and Qads is the amount of charge due to the electrolysis of the adsorbed species and is proportional to the surface concentration of the adsorbed material. Of the three components, only Qdiff is time-dependent. One way of calculating Qads is to measure the difference in Qdl by performing a CC experiment on a background solution.
However, this assumes that the Qdl is the same with or without electrochemically active species. This is not necessarily true. A more accurate method is to use a double step CC.
This is because Qdl can be removed by calculating the difference between the intercepts of the forward and reverse Anson plots (Fig. 5-6).
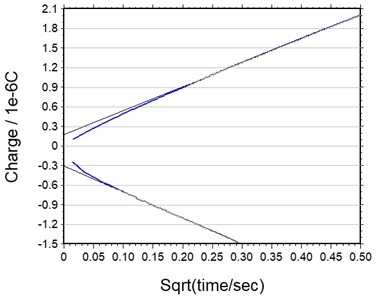
Fig. 5-6 Forward/reverse Anson diagram.
Part 6: Pulse Technique / Step Wave Voltammetry (SCV)
Pulse Technique
One of the disadvantages of linear sweep techniques is the presence of reverse current (capacitive current). Therefore, using these techniques for quantitative concentration measurements is not a good method.
The detection limit is affected by this background current.
- The important variables of the pulse technique are:
- a. The pulse amplitude is the height of the potential pulse and is displayed in mV.
- b. The pulse width is the duration of the potential pulse and is displayed in msec.
- c. The sample width is the elapsed time (msec) of the pulse of the measurement current.
It must be at least 3msec shorter than the pulse width (3 msec is required for capacitive current to decay to zero). The current is sampled and averaged 16 times per msec. The default value for the sampling time is 17 msec. In other words, this is the time for one cycle of a commercial power (60 Hz) (so the line noise is zero on average).
- d. Pulse interval/ Dropping time - This is the time required for one potential cycle (msec) and should be at least twice the pulse width. The pulse interval is used for voltammetry experiments and the drop time is used for polarimetry experiments, where the potential pulse, current sampling and drop of mercury are interrelated.
Three pulse techniques with different potential pulse waveforms and number of sampling times are described below. The ability to eliminate background currents, improved sensitivity and lower detection limits (compared to linear scan techniques) make these methods ideal techniques for concentration quantification.
Step Wave Voltammetry (SCV)
This is a modified version of the DC polarography experiment, designed to reduce the effect of changes in the surface area of the mercury droplets. The potential waveform is shown in Figure 10. The potential is varied in constant steps (perfectly synchronized with the drop time cycle). The current is sampled at the end of each drop. The drop time and step size can be set to various values. This potential waveform is sometimes referred to as a step waveform.
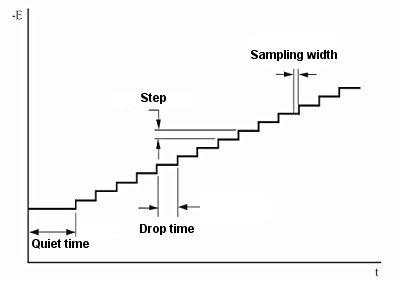
Fig. 6-1 SCV potential waveform.
The current response is shown in Fig. 6-2. The limiting current (id) is given by the llkovic equation.
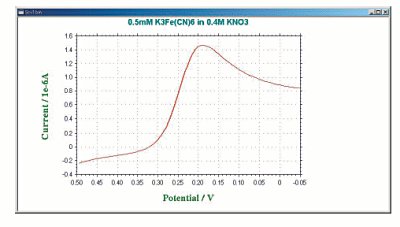
Fig. 6-2 Typical SCV current response.
id= 708nD1/2Cm2/3τ1/6
D = Diffusion coefficient (cm2/s)
C = Concentration (mol/cm3)
m = Mercury flow rate (mg/s)
τ = Sampling interval
The sensitivity and detection limits of SCV are similar to those of DC polarography (5 µA/mM, 10-5 M). The main advantage of SCV over DC polarography is the smoothed current output, which makes it easy to measure half-wave potentials and Faraday current. This is essentially a polarographic technique, but can be used as a low scan rate voltammetry technique. This improved version is called step voltammetry.
Part 7: Normal Pulse Voltammetry (NPV)
The potential waveform of the pulse technique is shown in Figure 7-1. It consists of a series of pulses with increasing potentials and amplitudes that return to their initial values between pulses. If the initial potential is sufficiently positive with respect to the redox potential (when considering the reduction reaction of the oxidant), when a small amplitude pulse is applied, the Faraday reaction will not occur and there will be no current response. When the pulse amplitude is sufficiently large that the pulse potential is near the redox potential, a Faraday reaction corresponding to the pulse (assuming a reasonably fast electron transfer rate) occurs. And the magnitude of this Faraday current depends on the diffusion rate and the electron transport rate.
When the pulse potential becomes sufficiently negative relative to the redox potential and electron transport occurs faster, the Faraday current becomes dependent only on the diffusion rate. In other words, the limiting current is reached.
This current response is shown in Fig. 7-2. The sigmoid waveform is similar to the waveform curve obtained in classical polarography experiments. This is why we call this method the normal pulse method (similar to HPLC forward phase, reverse phase, normal phase, and reverse phase, with the older historically being called normal). nPV has a higher limiting current than SCV, is a more sensitive technique (30 µA/mM), and has a lower detection limit (10-6M) can be obtained.
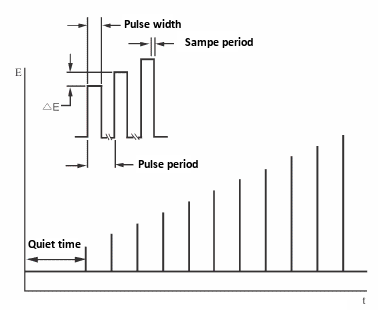
Fig. 7-1 NPV/P potential wave form.
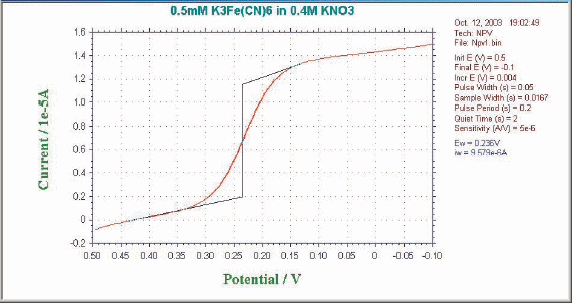
Fig. 7-2 Typical current response of NPV/P.
Part 8: Differential Pulse Voltammetry (DPV)
The DPV technique differs from the previous two techniques in that the current is sampled twice at each pulse interval. The potential waveform is shown in Fig. 8-1.
The pulse amplitude is constant and the base potential increases in small steps. That is, pulses of small amplitude are superimposed on a stepped waveform. The current is sampled before the pulse (i1) and at the end of the pulse (i2). The difference (i2 - i1) is recorded as a function of the base potential. Using reduction as an example, at potentials sufficiently positive above the redox potential, no electrode reaction occurs and the current difference is zero. The current difference reaches the maximum near the redox potential, and the current difference decreases to zero again when the diffusion rate is controlled. In NPV, the initial potential is set to a value at which the Faraday reaction does not occur.
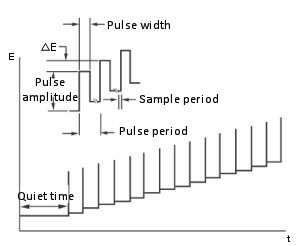
Fig. 8-1 Potential waveform of DPV.
The sensitivity of DPV is between that of NPV and SWV (20 µA/mM). The lower limit of detection is less than 10-7M.
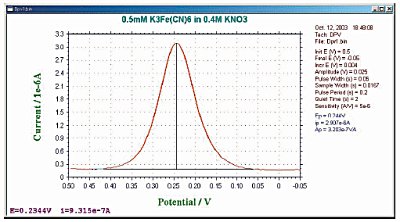
Fig. 8-2 Typical current response of DPV.
Part 9: Osteryoung square wave voltammetry (OSWV)
The square wave technique is closely related to both the pulse technique and the AC voltammetry technique. Similar to DPV / P, they give a peak-shaped current response curve and effectively eliminate background capacitive currents. The main advantages are high sensitivity and speed.
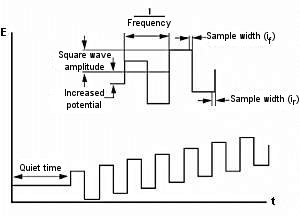
Fig. 9-1 Potential waveform of OSVW.
This waveform is shown in Fig. 8-1. The potential waveform of OSWV is a square wave superimposed on the stepped waveform. It can be viewed as a series of alternating directional pulses (hence, related to both pulse and AC techniques). The current is sampled at the end of each pulse (or every half cycle).
The default current output is given as the difference current (Fig. 8-2), but the forward current (if) and reverse current (ir) are also calculated separately (Fig. 8-3).
In the case of a reversible system, the reverse current is also large, so the difference current is larger than either the forward current or the reverse current. This is one reason why OSWV is more sensitive than DPV. The magnitude of the reverse current is used to study the reversibility of electron transfer.
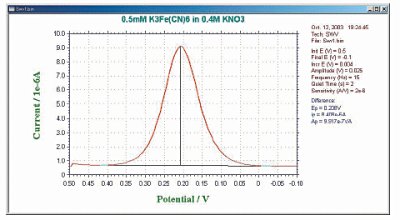
Fig. 9-2 Differential current response of OSWV.
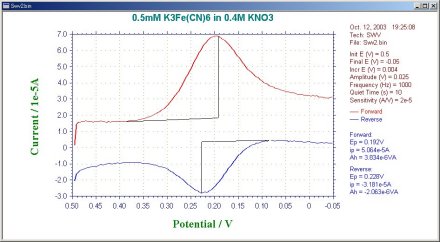
Fig. 9-3 Forward and reverse current response of OSWV.
Another advantage of OSWV over DPV/P is its speed. Scan speeds of up to 5,000 V/s are available, but typically scan speeds of 100 mV/s to a few V/s are used. (The scan speed of OSWV depends on the square wave frequency.) This is much faster than the DPV (10 to 20mV/s) scan speed. In addition, sensitivity compared to DPV increases with increasing scan speed, even in irreversible processes. The high sensitivity and high speed of OSWV make it a versatile method for quantitative analysis of electrochemically active species in solution. The lower limit of detection can be further lowered by using the stripping method.
Part 10: Alternating Current (AC) Technology (ACV, SHACV)
Sine wave AC techniques are essentially divided into two categories. In the AC impedance technique, the DC potential (typically to the redox potential) is kept constant, and a small amplitude AC potential (variable frequency over a certain range) is applied (Fig. 10-1).
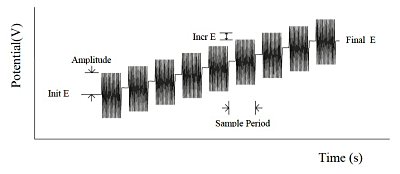
Fig. 10-1 AC impedance potential waveform.
The second harmonic AC voltammetry method is a variation of the AC impedance method. The frequency is kept constant and the DC potential changes slowly. The DC potential is used to change the concentration of oxidized or reduced species at the surface of the working electrode.
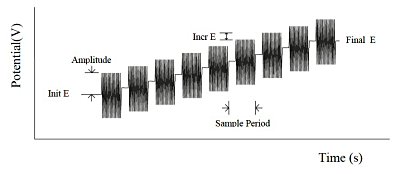
Fig. 10-2 SHACV potential waveform.
And the AC potential is then superimposed to perturb these concentrations. The effect of the AC potential is largest in the redox potential. Therefore, the AC current response at ACV is a peak waveform curve (Fig. 10-3).
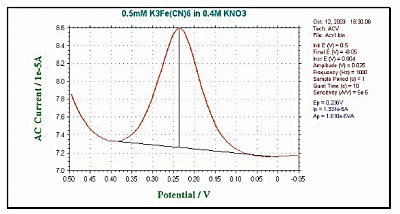
Fig. 10-3 Fig. 10-3 Typical ACV current response.
Since the AC current response depends on the electron transfer rate, AC voltammetry is basically used to investigate the reaction rate of electrode processes. These techniques are also used to investigate the chemical reactions of homogeneous systems in which the electrode reaction products continue to occur. However, other techniques (e.g. cyclic voltammetry, chronocoulometry) are superior to this method. Due to the equivalent capacitance of the interface region, there is a phase difference between the applied AC potential and the AC current response. It is often useful to measure the AC current at different phase angles.
In an ideal reversible system has a phase angle of 45°, while in a pseudo-reversible system (system with slow electron transfer) has a phase angle greater than 45°. Since reversibility depends on the time scale of the experiment, increasing the AC frequency usually results in a change from a reversible system to a pseudo-reversible system. The cotangent plot of the phase angle to (frequency)1/2 is used to calculate the electron transfer rate. The peak current ip for a reversible system is obtained by the following equation.

Fig. 10-3 Fig. 10-3 Typical ACV current response.
A = electrode surface area (cm2), ω = 2πx (AC frequency), D = diffusion coefficient (cm2/s),
C = concentration (mol/cm3), E = AC potential amplitude
As the system changes from reversible to pseudo-reversible (or even irreversible), ip decreases significantly and is no longer proportional to ω1/2. (It used to be said that irreversible processes are undetectable by AC techniques, but this is not the case, just that the peak current is smaller in such systems.) The AC current response to the AC potential is not linear.
It is the sum of the fundamental and its harmonics. The frequency response of the second harmonic (second harmonic SHACV/P) is often used. The information obtained by this technique is the same as for ACV/P and PSACV/P. Furthermore, the elimination of capacitive current is more efficient and the time scale is shorter. SHACV has been used to measure the redox potential of species that react rapidly during electrolysis. (Since the time scale of SHACV is shorter than that of cyclic voltammetry, the effect of chemical reactions that occur after charge transfer is reduced.) Fig. 10-4 shows a typical example of SHACV.
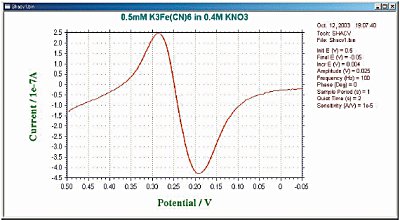
Fig. 10-4 Fig. 10-3 Typical SHACV current response.
Part 11: Hydrodynamic Modulation (HDM)
The current response to an applied potential is determined by many factors. The two most important points are the electron transfer rate and the mass transfer rate from the bulk solution to the working electrode surface. There are three ways in which mass transfer can occur.
- Diffusion - Molecular motion due to concentration gradient
- Electrophoresis - Molecular motion due to potential gradient
- Convection - Molecular motion caused by disturbances such as vibration and agitation
In order to obtain quantitative data from voltammetry experiments, it is important that the mass transfer mode is defined in a form that is easy to analyze mathematically. The addition of a fully dissociated electrolyte, electrophoretic effects can be ignored in all voltammetry experiments. The mass transfer mode of the system consists mainly of diffusion and convection. In many voltammetry experiments, convection is eliminated by not stirring the solution and preventing external vibrations (such conditions are only maintained for a relatively short period of time).
Voltammetric method using static solution state includes cyclic voltammetry (CV), chronocoulometry, pulse and square wave techniques. In addition to the experimental difficulties of maintaining convection-free conditions, diffusion dominated experiments are limited by the lack of methods to change the mass transfer rate.
In the hydrodynamic technique, molecules are transported to the electrode surface in a well-defined manner. That is, by stirring the solution, or by pumping the solution through the flow cell as in liquid chromatography/electrochemical detection systems. The most widely adopted method is to rotate the electrode using a rotating disk electrode. Hydrodynamic techniques have many advantages over static solution techniques due to the increased mass transfer rate into and out of the electrode surface. As a result of the balancing of mass transfer and electron transfer, faster mass transfer rates allow steady state to be reached sooner, and steady state is maintained when the scan rate is slow enough (usually about 20 mV/s or less).
One advantage of steady-state voltammetry is that at a given potential, the current is not dependent of both scan direction and time. In this case, the voltammogram is characterized by a sigmoid curve. Fast mass transfer increases the sensitivity of quantitative analysis, and rotating disk electrodes are often used in the precipitation step of stripping experiments. The limiting current (mass transfer current) for reversible processesis given by the Levich equation.
C = concentration (mole/cm3), D = diffusion coefficient (cm2/s), ω = 2πf ((rotation speed/rps), ν = dynamic viscosity
Therefore, the plot il vs. ω1/2 for a reversible process is a straight line (Levich plot).
In this case, reversible means that fast electron transfer is required relative to the mass transfer rate, i.e., the redox reaction may shift from reversible to quasi-reversible when the rotational speed increases. This is shown by the deviation from linearity in the Levich plot. The electron transfer rate is calculated from the kinetic current when the rotational speed is extrapolated to infinity.
This kinetic current is obtained from the intercept of the inverse Levich plot (l/il vs.1/ω1/2). This method is often used in corrosion and battery research. It is also used to measure the electron transfer rate through a polymer film coated on the electrode surface.
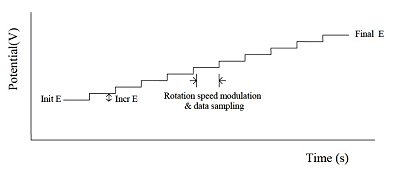
Fig. 11-1 HDM applied potential waveform.
Hydrodynamic modulation (HDM) is a related technique that changes the rotation frequency in a sinusoidal manner. While il is proportional to ω1/2, ω1/2 itself also changes. The alternating current is processed using the usual data processing methods. That is, after passing through the filter, data is processed after rectification or phase discrimination detection.
According to the Levich equation, il = Kω1/2, where ω1/2 = ω01/2 + Δω1/2sinσt; (ω0 is the center rotation speed and is modulated by a sine waveform with frequency σ, amplitude Δω1/2 , see Fig. 11-2), the AC output is shown in Fig. 11-3, and Δi is given by the following equation:

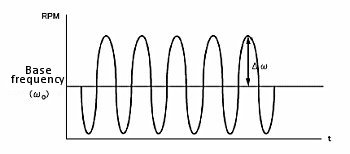
Fig. 11-2 Modulation of rotational speed using HDM technique.
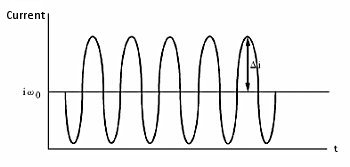
Fig. 11-3 AC Output of HDM.
Part 12: Amperometry technique (i-t)
These are chronoamperometric techniques. That is, current is measured as a function of time. Typically, such techniques are used for current titration, amperometric sensors, flow cells, etc.
The difference between the three available techniques is the potential waveform used. That is, the potential waveform is devised to improve selectivity. The simplest potential waveform is the fixed potential. This is a TB waveform. The shape of the TB and a typical current response are shown in Fig.12-1 and 12-2, respectively.
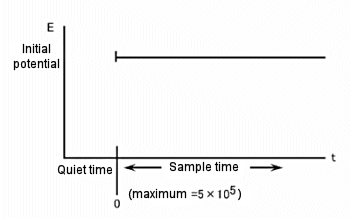
Fig. 12-1 Potential waveform of TB.
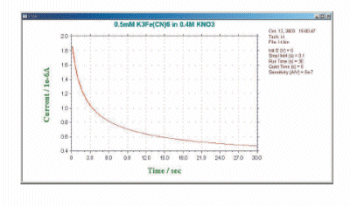
Fig. 12-2 Typical current response of TB.
One variant of the amperometric potential waveform superimposes a continuous pulse of constant amplitude (Fig. 12-3). This is a differential pulse amperometry (DPA) technique that involves cleaning the electrodes. The current is sampled just before the pulse and before the end of the pulse, allowing for effective elimination of background currents. Since the differential current is displayed, this method allows the potential window to be checked and helps improve detection selectivity. A typical current response of a DPA is shown in Fig. 12-4.
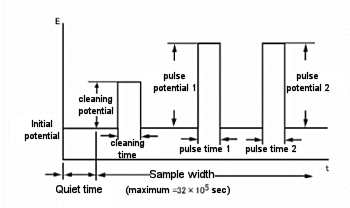
Fig. 12-3 DPA potential waveform.
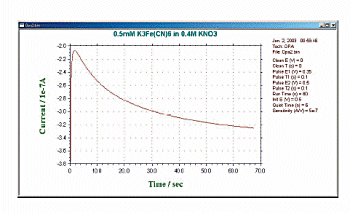
Fig. 12-4 Typical current response of DPA.
Part 13: Double Differential Pulse Amperometry (DDPA)
Double differential pulse amperometry is performed by combining two sets of differential pulse amperometry. Two sets of data are recorded and displayed. Each set consists of a cleaning potential without current sampling and two pulse potentials with current sampling.
The current at the end of each pulse is recorded as a function of time. During the experiment, only the difference between the two current samplings is displayed. At the end of the experiment, the current in response to the two potential pulses is available for display. The potential waveform is applied as a function of the time and current sampling scheme (see Fig. 13-1).
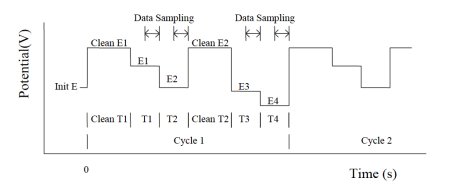
Fig. 13-1 Potential waveform is a function of time and current sampling scheme.
Types of data that can be plotted
- Difference 1
- Difference 2
- Difference 1 & 2
- Forward 1
- Reverse 1
- Forward and Reverse 1
- Forward 2
- Reverse 2
- Forward and Reverse 2
- Forward and Reverse 1 & 2
Part 14: Triple Pulse Amperometry (TPA)
Simple amperometry reduces sensitivity and selectivity because detection of reducing sugars, primary amines, and thiols requires high potentials.
The triple-pulse potential waveform (TPA) is particularly well suited for these molecules. As the name suggests, three potential pulses are applied sequentially and the current is sampled at the end of each pulse. (Fig. 14-1)
This waveform is repeated for the required number of cycles, and one of the current samples is presented as a function of time (the other two are saved for later processing).
In the case of sugar detection, the pulse train is as follows.
The first pulse cleans the electrode surface, and the second pulse is the potential to create an oxide layer on the surface and adsorb the molecules of interest onto the electrode. Then, the third pulse is used to detect these molecules. Since this is a special case, TPA should be considered a general purpose waveform that can be used in many electrochemical sensor applications.
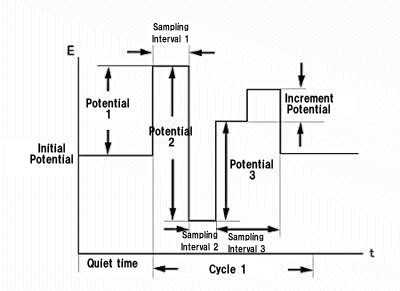
Fig. 14-1 Potential waveform of TPA.
Part 15: Integrated Pulsed Amperometric Detection (IPAD)
The Integrated Pulsed Amperometric Detection (IPAD) can apply six segments of potential sweeps or steps. The current is sampled and integrated between the first four potential segments. The last two potential steps are for electrode processing and cleaning. The integrated current is averaged and recorded as a time function. The potential waveforms in the figure below shows that it is applied as a time function and current sampling scheme.
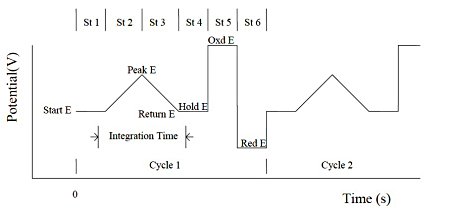
Fig. 15-1 Potential waveform of IPAD.
Part 16: Bulk Electrolysis (BE)
The principle of bulk electrolysis (BE) is quite simple. If only oxidized molecular species are initially present, the potential is set to a negative value sufficient to cause rapid reduction and is maintained at this value until only reduced species are present in solution. According to Faraday's law, the total charge (Q) passed during the BE experiment is related to the number of moles (N) of the initially present molecules of the oxidized state of the substance and the number of electron transfers (n) of the individual molecules, where F is Faraday's constant (96,500 C/mol). Thus, if either n or N is known, one can be calculated.
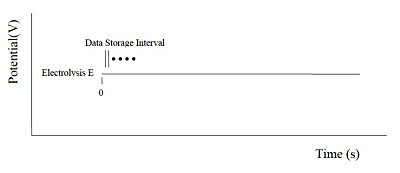
Fig. 16-1 Potential waveform of BE.
The cells required for BE are different from those needed for voltammetry experiments (only a small fraction of the electrochemically active molecule of interest is electrolyzed in voltammetry). The rate of electrolysis is increased by using a working electrode with a large surface area (e.g., platinum wire mesh or mercury pool) and a counter electrode with a large surface area (e.g., platinum coil or wire mesh).
The solution is agitated to increase the rate of mass transfer in and out of the working electrode. The counter electrode is isolated from the working electrode to prevent interference between electrolysis products at the counter electrode and electrolytic species at the working electrode. Care must be taken in selecting the material that isolates the working electrode from the counter electrode. This is because high electrical resistance of the material may affect the efficiency of the electrolysis.
Prior to the BE experiment, select the potential. For reduction, the ideal potential should be about -200 mV below the redox potential (measured, for example, by cyclic voltammetry). The rate of electrolysis is governed by the rate of mass transfer to the working electrode. However, if the electrolytic potentials of other electrochemically active substances (e.g., electrolytes, solvents, other components in solution) are close, a potential that is not very far from the redox potential may not be used.
During the BE experiment, the clock on the PC monitor will display the experimental time. The average current for the first interval and the average current ratio for each interval are also displayed. This ratio is an important criterion for determining the degree of electrolysis. In general, electrolysis is considered to be finished when the ratio reaches 1% (the residual current, which is the background current). The final current ratio can also be set by the user (1% is the default value). The results are displayed in a charge vs. time plot (Fig. 16-2) or current vs. time plot (Fig. 16-3).
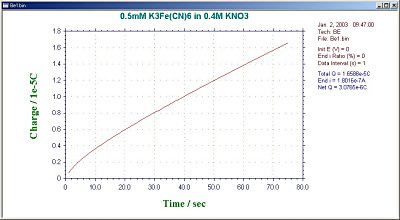
Fig. 16-2 Charge vs. time plot for a typical BE.
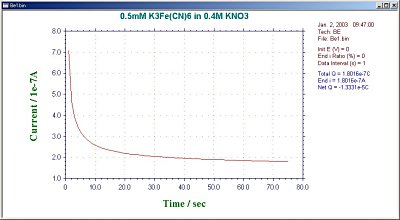
Fig. 16-3 Current vs. time plot of a typical BE.
Part 17: Impedance (IMP)
In voltammetric methods, the potential is varied within a specific range and the current response is monitored. In a single voltammetric measurement, the timescale is kept constant (e.g. scan rate).
In an IMP (impedance measurement) experiment, the potential is fixed at a specific value (e.g. equilibrium potential) and a small amplitude AC potential is superimposed. In a single IMP measurement, a certain AC frequency range is applied and electrochemical and other physical processes with different timescales can be detected.
The Fourier transform method is used for both waveform generation and data analysis. In the frequency domain, a number of frequencies with equal amplitude and irregular phase with almost the same ratio of one frequency to the next are selected (Fig. 17-1).The result is a set of relatively equally spaced frequencies whose frequencies are not integer multiples of each other.
This set of frequencies is converted to a digital representation of the time-domain waveform and applied to the cell via a D/A converter and analog filter. This procedure is repeated many times to improve the signal-to-noise ratio. In the high frequency range, the cycle time is relatively short and many integrations are performed without increasing the experimental time.
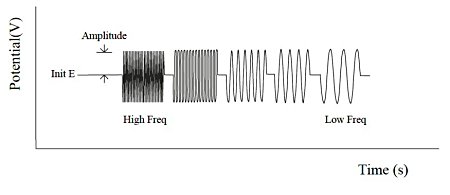
In each frequency range, the current response is monitored with the sensitivity automatically adjusted. After each frequency range measurement is completed, the data is analyzed by a Fourier transform algorithm. The representation of the experimental data is complicated by the phase difference between the applied potential and the current response. The result is expressed as an impedance (Z = E/I) or admittance (Y = 1/Z).
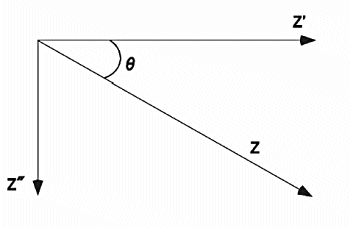
Fig. 17-2 shows the relationship between Z (total impedance), Z' (impedance in-phase with the applied voltage), Z" (impedance in-phase with the applied voltage 90°) and θ (phase angle). Note that these variables vary with frequency (ω).
Types of data that can be plotted
- Nyquist: -Z" - Z'
- Bode: LogZ & phase - Log(Freq)
- LogZ - Log(Freq)
- phase - Log(Freq)
- log(Z' & Z") - Log(Freq)
- logY - log(Freq)
- Admittance: Y" - Y'
- Warburg: Z" & Z' - 1/sqrt(w)
- Z' - wZ"
- Z' - Z"/w
- Cot(phase) - Sqrt(w)
- 1/wZ" - 1/wZ’
- Y"/w - Y'/w
One of the most difficult aspects of IMP measurement is the interpretation of experimental data. The basic idea is that an electrochemical cell can be replaced by an equivalent circuit in an electronic circuit. For example, the interface region resembles a capacitor with a capacitance of Cdl. There is also an uncompensated solution resistance Ru between the working and reference electrodes. Other components of the modeled electrochemical cell include electron transfer (Faraday impedance) and diffusive mass transfer (Warburg impedance).
The theoretical support for the Faraday impedance is as follows. If the applied voltage (A.C. amplitude) is small (about 5/n mV, where n is the number of electrons transferred), then there is a linear relationship between the applied voltage and current response. That is, I = E/Rf, where Rf is the Faraday impedance.
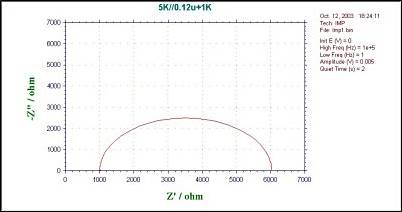
Rf is proportional to the inverse of the electron transfer rate. The smaller intercept is Z' = Ru and the larger intercept is Z' = Ru + Rf. The frequency corresponding to the largest semicircular -Z" value is equal to 1/RuCdl. Thus, the three components of this simple RC circuit are calculated from the IMP measurement.
Nyquist plots are the most commonly used method for displaying data. Bode plots have better resolution than Nyquist plots and are useful if there is more than one process dominating the system. Impedance plots can provide a lot of information, but they are very complex and can be difficult to explain.
In a Nyquist plot, for example, more than one semicircle may be present and often not in the positive quadrant . IMP measurements have been widely used to study electron transfer rates, e.g., in corrosion and battery studies. It has also been used to measure the rate of electron transfer through electrochemically active polymer films on electrode surfaces.
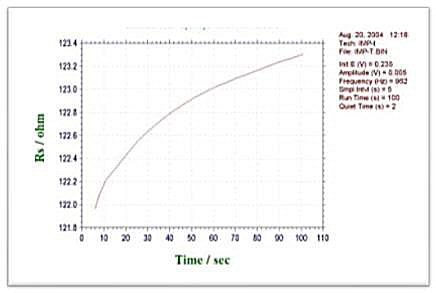
Part 18: Impedance-Time (IMPT)
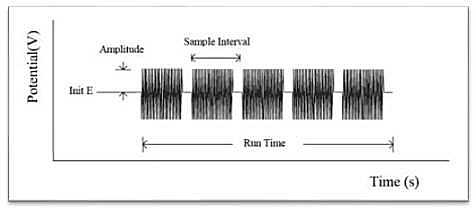
The impedance-time method holds the base potential at the initial potential. A sine wave is superimposed on the base potential. Current and voltage are sampled and analyzed for real and imaginary impedance components. The impedance is recorded as a function of time. The following figure shows the applied potential waveform as a function of time.
-Types of data that can be plotted
- LogZ - t
- phase - t
- Z - t
- Z' - t
- Z" - t
- log(Z" & Z') - t
- logY - t
- Y - t
- Y' - t
- Y" - t
- log(Y' & Y") - t
- Rs - t
- Os - t
- Rp - t
- Cp - t
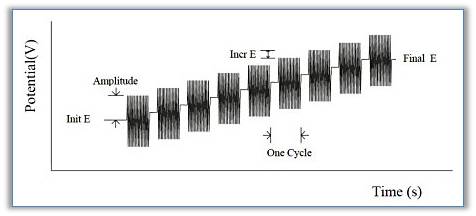
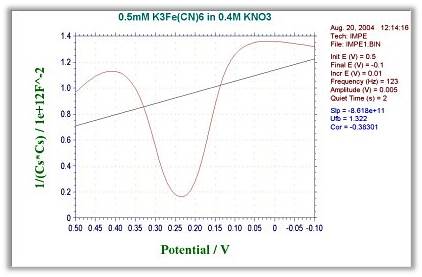
Part 19: Impedance-Potential (IMPE)
The impedance-potential method increments potential E from the initial potential to the final potential. A continuous sine wave is superimposed on the base potential. Current and voltage are sampled and analyzed for real and imaginary impedance components. The impedance is recorded as a function of potential. The following figure shows the applied potential waveform as a function of time.
-Types of data that can be plotted
- LogZ - E
- phase - E
- Z - E
- Z' - E
- Z" - E
- log(Z" & Z') - E
- logY - E
- Y - E
- Y' - E
- Y" - E
- log(Y' & Y") - E
- Rs - E
- Os - E
- Rp - E
- Cp - E
- 1/(Cs*Cs) - E : Mott-schottky
- 1/(Cp*Cp) - E : Mott-schottky
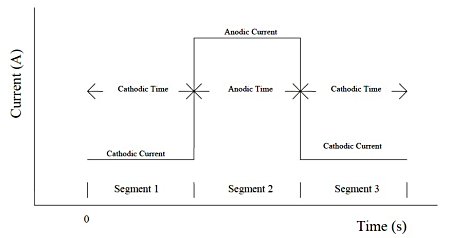
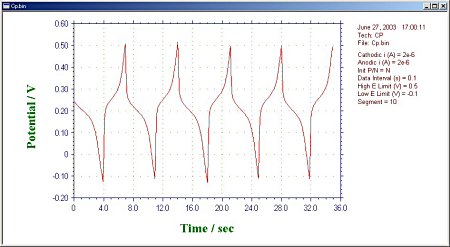
Part 20: Chronopotentiometry (CP)
Chronopotentiometry allows control of two current levels passing through the working electrode. The switching of the current polarity can be controlled by time or potential. The potential is recorded as a function of time. The current waveform in Fig. 20-1 shows the current flowing through the working electrode as a function of time.
Types of data that can be plotted
- Potential - time
- dE/dt - time
- dt/dE - time
- Potential - charge
Part 21: Chronopotentiometry with Current Ramp (CPCR)
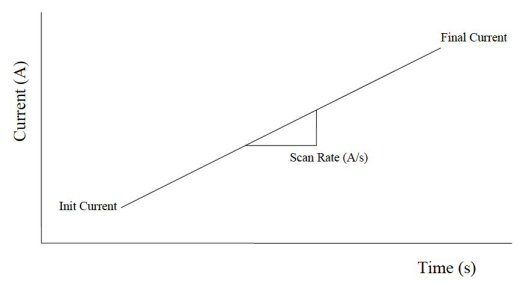
Chronopotentiometric with current ramp can apply a current ramp to a working electrode. The potential is recorded as a function of time. The following figure shows a ramp-shaped current waveform being applied to the working electrode as a function of time.
Part 22: Sweep-Step Functions (SSF)
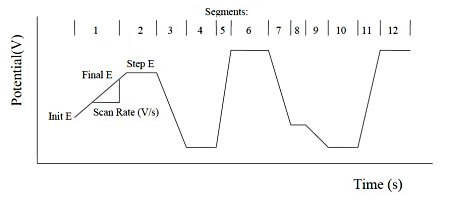
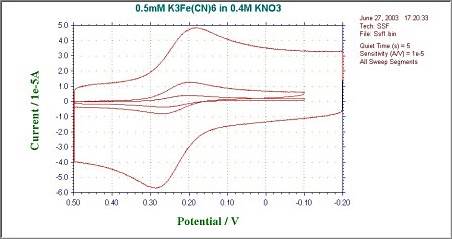
The sweep-step function allows six potential sweeps and six potential steps to be used together. Fig. 22-1 shows that the potential waveform is applied as a time function. With 12 segments available, it can be thought of as an arbitrary waveform generator. Any segment can be skipped, providing flexibility in waveform control. The current is recorded as function of time. For sweep segments, it can be set as an initial and final potentials, or as a potential sweep rate.
Part 23: Multi potential step method (STEP) & Multi current step method (ISTEP)
1. Multi potential step method (STEP)
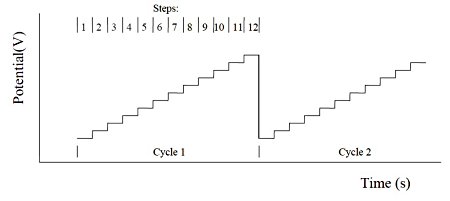
The multi potential step is repeated with 12 potential steps applied. The current is recorded as a time function. The figure below shows the potential waveform applied as a time function.
2. Multi current step method (ISTEP)
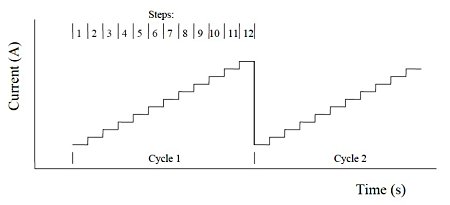
The multi-current step is repeated with 12 current steps applied. The potential is recorded as a time function. The figure below shows the current waveform applied as a time function.
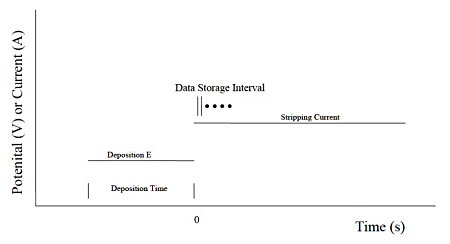
Part 24: Potentiometric stripping analysis (PSA)
In potentiometric stripping analysis, a potential-controlled deposition step is applied first. After deposition, each component accumulated on the electrode surface is sequentially released by applying a constant current. The potential change at that time is recorded as a time function. The figure below shows the potential and time settings during the deposition stage and the current setting during the release stage.
